


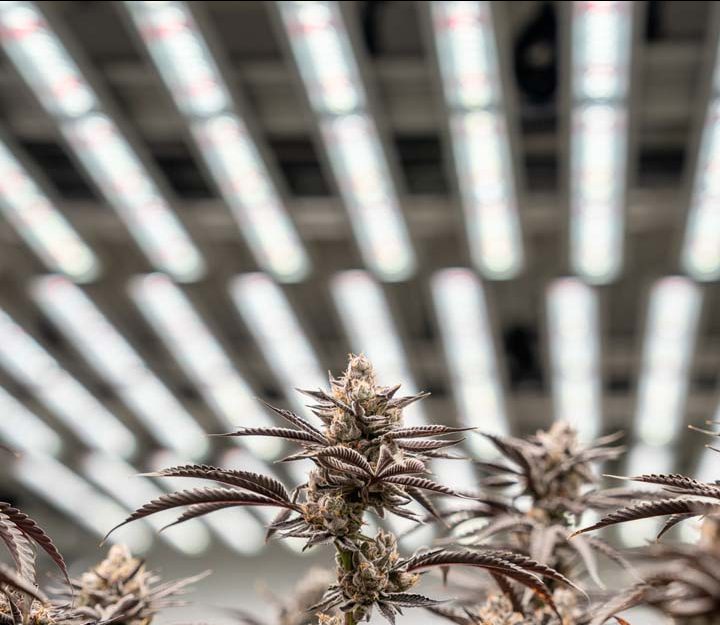
A lower utility bill doesn’t automatically mean you’re running an energy-efficient growth. You can cut wattage and still lose yield if the light reaching the canopy is uneven, poorly distributed, or concentrated in the wrong places. You can hit your PPFD target in the center of the room while the perimeter falls hundreds of micromoles behind.
The better question is really how much usable crop are you producing from the photons you’re paying for? For commercial cannabis cultivation, that comes down to more than fixture wattage. You need to know where the light is landing, how evenly the canopy receives it, and whether the crop can actually use it.
1. Fixture Efficacy: µmol/J
Photosynthetic photon efficacy, or PPE, tells you how many micromoles of PAR photons a fixture produces for every joule of electricity consumed. Under DLC Horticultural Lighting V4.0 requirements, qualifying LED products must reach at least 2.5 µmol/J. FOHSE’s A3i Pro is rated up to 2.91 µmol/J.
That difference adds up across hundreds of fixtures running 12 or 18 hours per day. But efficiency at the fixture only matters if those photons are reaching a productive canopy.
Check: Compare PPE alongside PPF, fixture wattage, mounting height, and measured PPFD. A strong µmol/J rating doesn’t fix poor spacing or weak coverage.
2. PPFD Distribution Across the Canopy
An average PPFD can make a poorly lit room look better than it is. A flower room averaging 1,000 µmol/m²/s might have some areas at 700 and others at 1,300. On paper, the room hit the target. The plants are experiencing something very different. Build a repeatable measurement grid and map PPFD under normal operating conditions.
Check:
- Center versus perimeter
- Corners
- Areas between fixtures
- Bench or table positions
- Structural obstructions
- Aisle edges
If the same low zones show up every cycle, increasing fixture output may only make the brightest areas brighter. Look at spacing, mounting height, fixture orientation, and overlap first.
3. Canopy Penetration
Top canopy PPFD only tells you what’s happening at the top. Take readings deeper into the plant at consistent heights. If the upper canopy measures 1,100 µmol/m²/s while productive lower sites are receiving 250, pushing the room to 1,200 probably won’t solve the actual problem. Plant spacing, pruning strategy, architecture, spectrum, and fixture distribution all affect how light moves through the crop.
Check: Record upper, middle, and lower-canopy PPFD in the same locations each week. Watch how the gap changes as biomass develops.
Better penetration can mean more of the photons you’re already paying for reach productive sites.
4. DLI Balance
PPFD measures intensity at one moment. Daily light integral measures the total PAR delivered over the photoperiod. The calculation is:
PPFD × hours of light × 3,600 ÷ 1,000,000
At 900 µmol/m²/s for 12 hours:
DLI = 38.9 mol/m²/day
There isn’t one correct DLI for every cultivar or production strategy. What matters is whether the light delivered across the day matches what the crop can use. That includes distribution. Two plants can technically be in the same room and finish the day with very different DLI if one sits under a high-output zone and the other is near the edge.
Ask: Are you delivering the target DLI across the canopy, or only in the best-lit parts of the room?
5. Power Density
Total fixture wattage is hard to compare between rooms of different sizes. Lighting power density gives you a cleaner baseline: Total lighting watts ÷ square feet of active canopy
Then compare that number against PPFD distribution and harvest output. Two rooms can both operate at 40 W/ft² and deliver very different usable light at crop level. One may have strong overlap and balanced coverage. Another may waste power in hot spots while the perimeter remains under lit.
Check: Put W/ft², average PPFD, minimum PPFD, and yield/ft² side by side.
The goal isn’t simply more watts per square foot. It’s making those watts useful across as much productive canopy as possible.
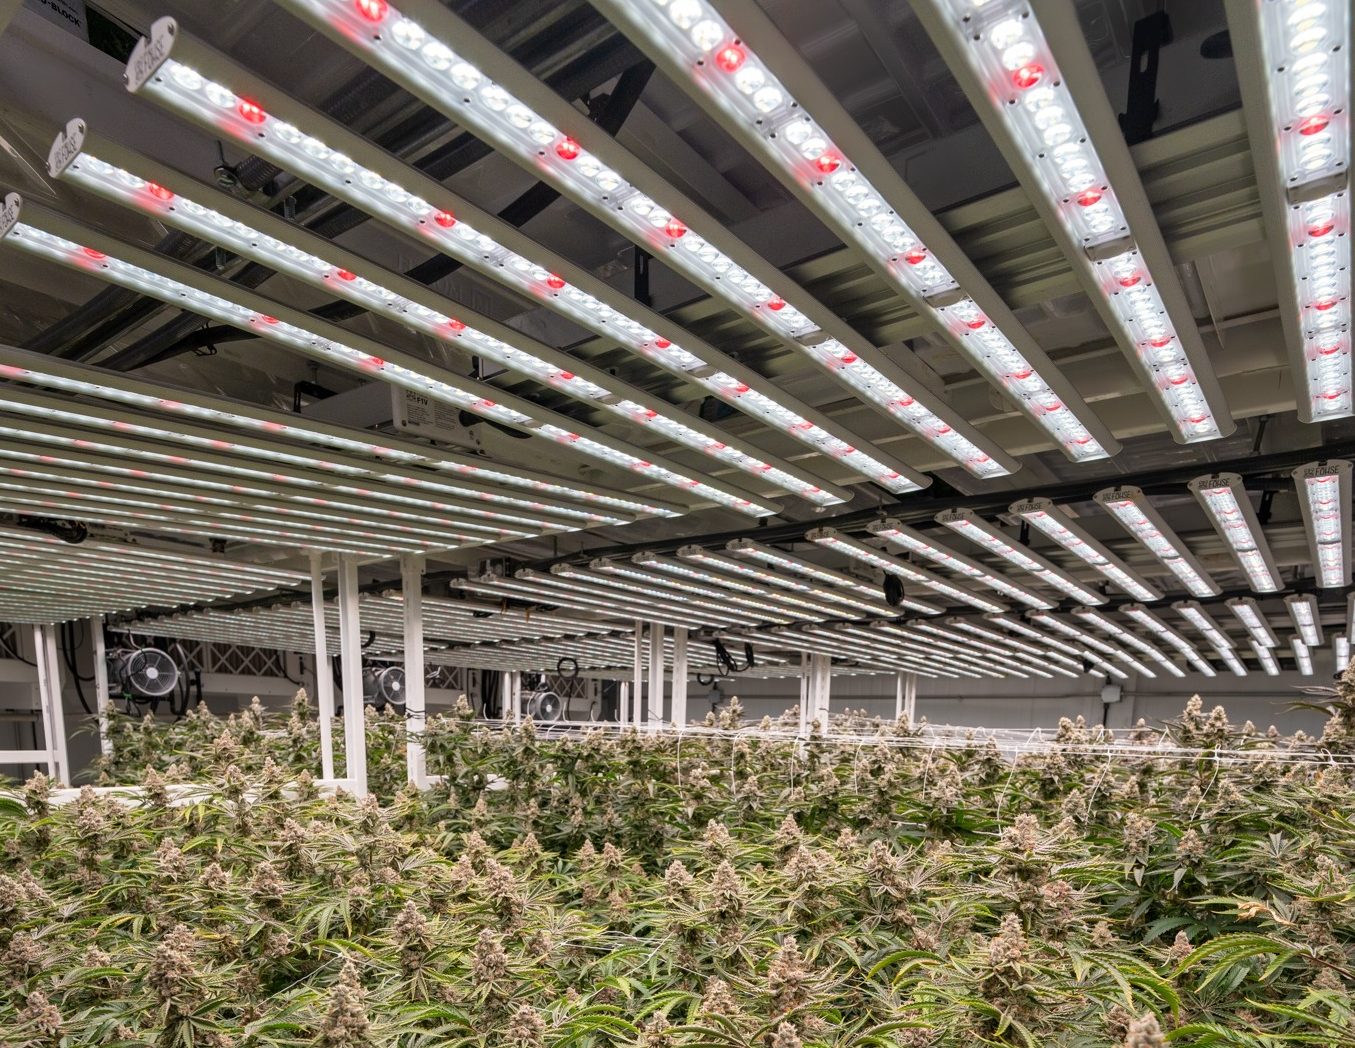
6. Energy Use per Gram: kWh/g
If ownership wants one number that connects the electric bill to production, start here. Divide the total electrical consumption for a production cycle by the grams of saleable flower harvested.
Example:
180,000 kWh ÷ 90,000 g = 2.0 kWh/g
Now compare that number after the next harvest. If electricity use drops 8% but saleable yield drops 15%, the room didn’t become more efficient. It just used less power. Better light distribution can work the other direction. If more of the canopy reaches productive intensity without adding unnecessary wattage, yield can improve while kWh/g moves down. Track: kWh/g by room, cultivar, and cycle. Building-wide averages can hide weak rooms behind strong ones.
7. Canopy Penetration
A quantum sensor at the top of the canopy only tells part of the story. Take additional readings deeper into the plant at consistent heights. For example, if the upper canopy measures 1,100 µmol/m²/s while productive lower sites are receiving 250, increasing the room to 1,200 may not solve the actual problem.
Plant spacing, pruning strategy, architecture, fixture distribution and spectrum can all affect how photons move through the canopy. Check: Record upper, middle and lower readings in the same locations each week. Watch the gap as biomass develops.
8. Dehumidification Energy
As canopy mass increases, so does moisture load. More productive plant material can mean more transpiration, longer dehumidifier runtime, and additional heat that HVAC equipment has to remove.
Track dehumidifier kWh and condensate removed. At minimum, compare runtime by week of flower. A sudden jump can point toward irrigation changes, increased biomass, infiltration, or equipment degradation. The goal isn’t to minimize dehumidification at all costs. It’s to understand what additional plant load is costing the room.
9. VPD Stability
Higher PPFD changes what the crop asks from the rest of the room. As light intensity increases, transpiration demand can increase too. That makes VPD control part of the lighting conversation. A room averaging 1.3 kPa VPD isn’t necessarily holding 1.3 kPa. It might swing between 0.8 and 1.8 throughout the day. Instead of relying only on daily averages, look at time spent outside your target band.
Then compare those excursions against:
- Irrigation events
- Lights-on
- Lights-off
- HVAC cycling
- Dehumidifier operation
If you’re pushing more photons into the canopy, the environmental system has to keep up.
10. Run-to-Run Consistency
A strong room should be repeatable. Track the same core numbers every harvest:
kWh/g + yield/ft² + average PPFD + minimum PPFD + DLI + HVAC runtime + VPD excursions
Then compare cycles with similar genetics and recipes. If one harvest produces 80 g/ft² and the next produces 65 under supposedly similar conditions, something moved. That variance may point to crop work, irrigation, climate control, fixture output, layout, commissioning, or measurement problems. For growers, that means more predictable crop response. For engineers and operators, it gives you data to troubleshoot. For ownership, it makes it easier to see whether capital is translating into repeatable production.
What Better Lighting Efficiency Actually Looks Like
The goal isn’t the lowest wattage or the highest fixture efficacy rating. It’s getting more of the light you’re already paying for onto a productive canopy. That means fewer high and low zones. Better edge coverage. More usable light deeper in the plant. DLI that matches the crop strategy. HVAC that isn’t absorbing unnecessary load. And yield that repeats from one run to the next.
Before adding fixtures or increasing output, map the room. If the center is hitting the target while the edges and lower sites are falling behind, the problem may be spacing, mounting height, overlap, or layout rather than a lack of wattage.
FAQ
What is light uniformity in a grow room?
Light uniformity describes how evenly PPFD is distributed across the crop canopy. A room with strong uniformity has a smaller gap between its brightest and darkest measured points. This helps reduce large differences in daily light exposure across the same growing area.
What is a good light uniformity ratio for indoor cultivation?
A minimum-to-average ratio of about 0.8 or higher is a useful benchmark for many horticultural applications. For example, if average PPFD is 1,200 µmol/m²/s, a 0.8 ratio means the lowest measured point is about 960 µmol/m²/s.
Why is PPFD lower around the edges of a grow room?
Low edge readings can come from fixture spacing, mounting height, room geometry, limited overlap, canopy layout, or nearby obstructions. Increasing fixture output isn’t always the right fix. The pattern of the PPFD map can help identify the actual cause.
How can growers improve light uniformity?
Start by identifying where high and low PPFD readings occur. Then compare the map against fixture spacing, mounting height, canopy dimensions, obstructions, and output settings. In many cases, correcting layout or overlap is more effective than simply increasing fixture intensity.


