


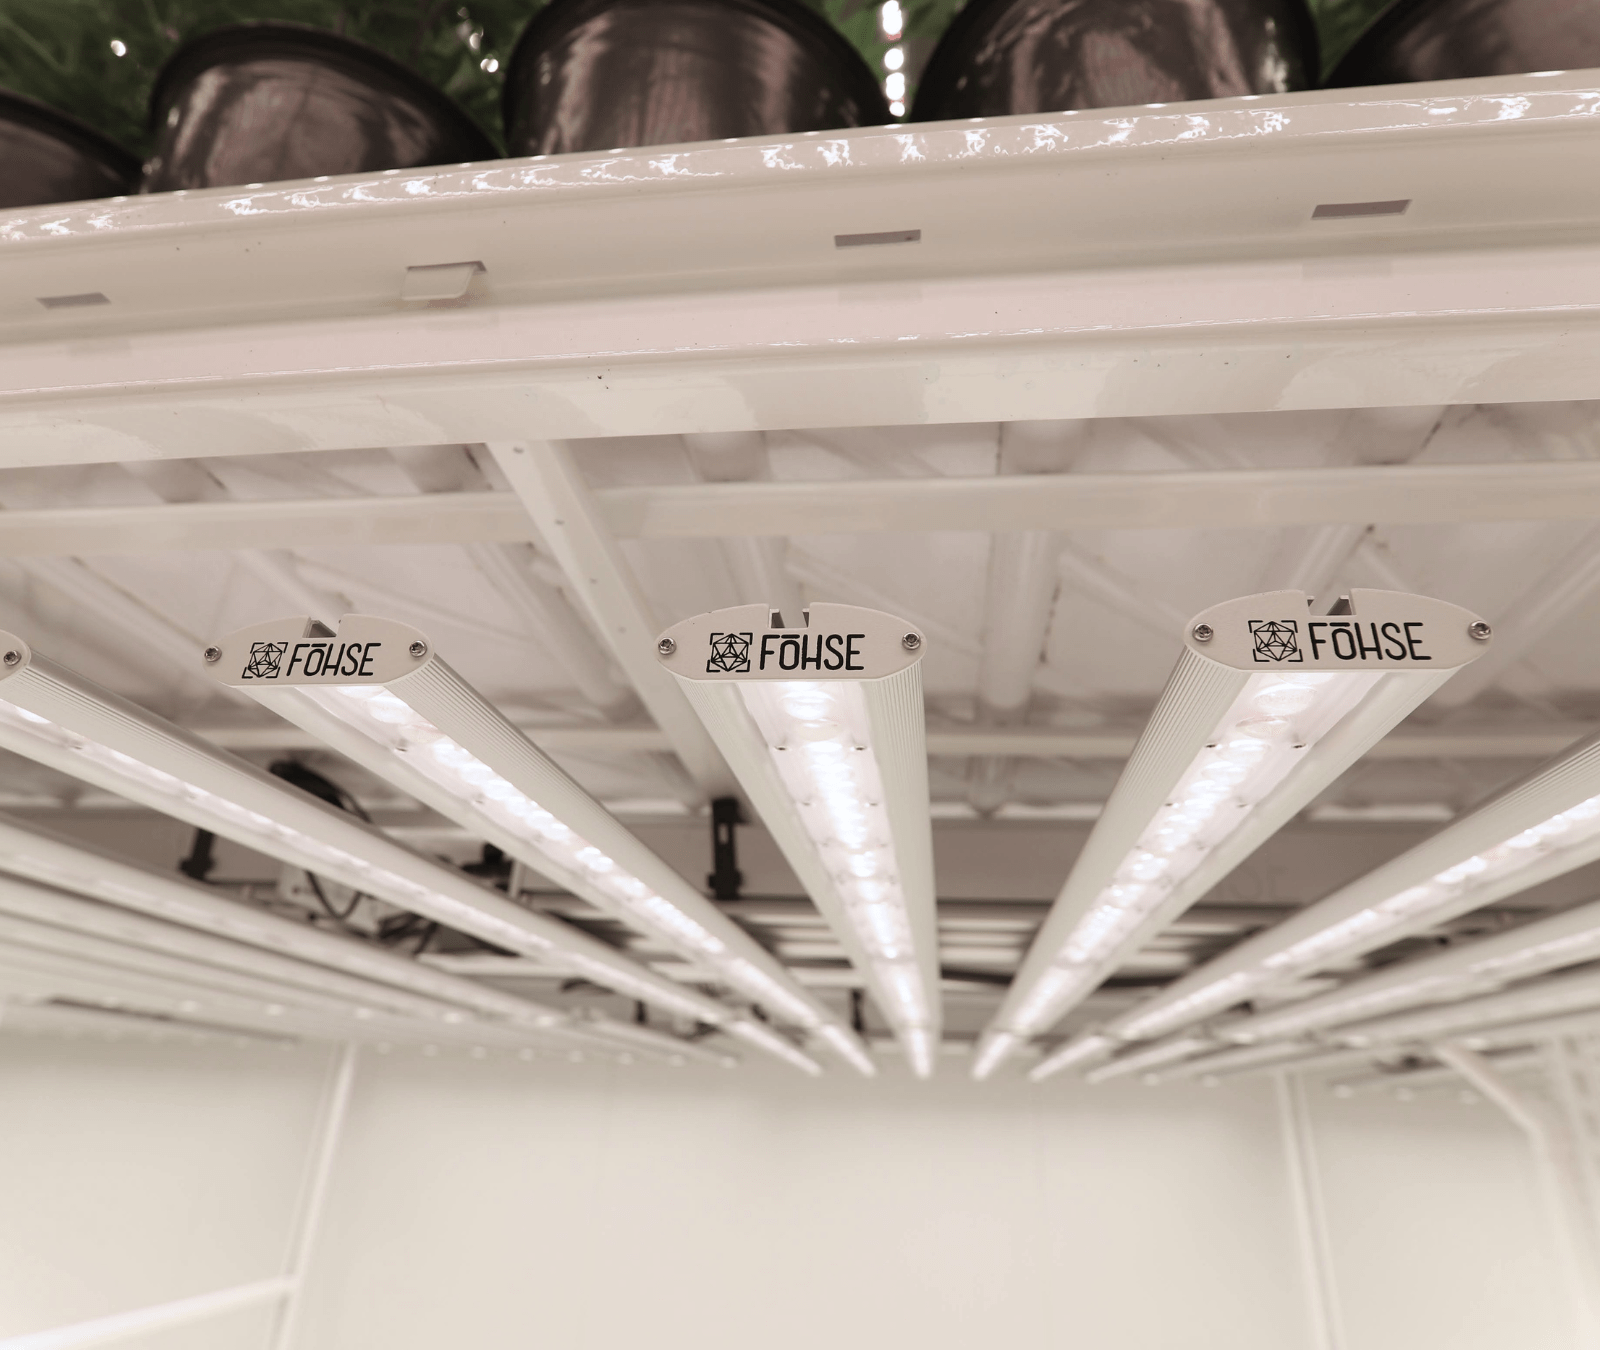
Walk into two commercial grow rooms with identical square footage, identical fixture counts, and even the same cultivar in the pots, and you can still end up with two very different utility bills and two very different harvests. The difference usually isn’t the equipment. It’s whether anyone in the building is actually measuring what that equipment is doing.
“Energy efficient” gets used as a label you slap on a room after installing LEDs, but efficiency isn’t a purchase; it’s a result. It shows up in numbers, and those numbers need to be tracked consistently, not glanced at once during commissioning and forgotten. Below are 10 metrics that distinguish a genuinely efficient facility from one that just looks that way on a spec sheet.
1. µmol/J (Photon Efficacy)
Photon efficacy measures how many micromoles of photosynthetically active radiation a fixture produces per joule of electricity it consumes. It’s the closest thing the lighting world has to a fuel-economy rating, and it’s the number most manufacturers lead with. Fixtures like FOHSE’s Aries 640W publish efficacy in the 2.55–2.80 µmol/J range, providing growers with a documented baseline to compare against before making a purchase.
But efficacy alone doesn’t guarantee a good outcome. A fixture can hit an impressive µmol/J number on paper and still underperform in a real room if the spectrum is wrong for the crop stage or the optics scatter light instead of directing it downward. Efficacy is where the efficiency conversation starts.
2. kWh/g (Energy per Gram of Yield)
If µmol/J tells you how efficient a fixture is, kWh/g tells you how efficient your entire operation is. This metric divides total facility energy draw lighting, HVAC, dehumidification, everything on the meter, by finished, sellable output. It’s the number that actually reconciles with a utility bill.
Two rooms running the same fixtures can post very different kWh/g figures depending on canopy density, training technique, and how well the climate system is tuned to the lighting load. Track it every cycle, not just once after a retrofit, and you’ll start to see which changes are actually moving the needle versus which ones just felt like improvements.
3. HVAC Run Time
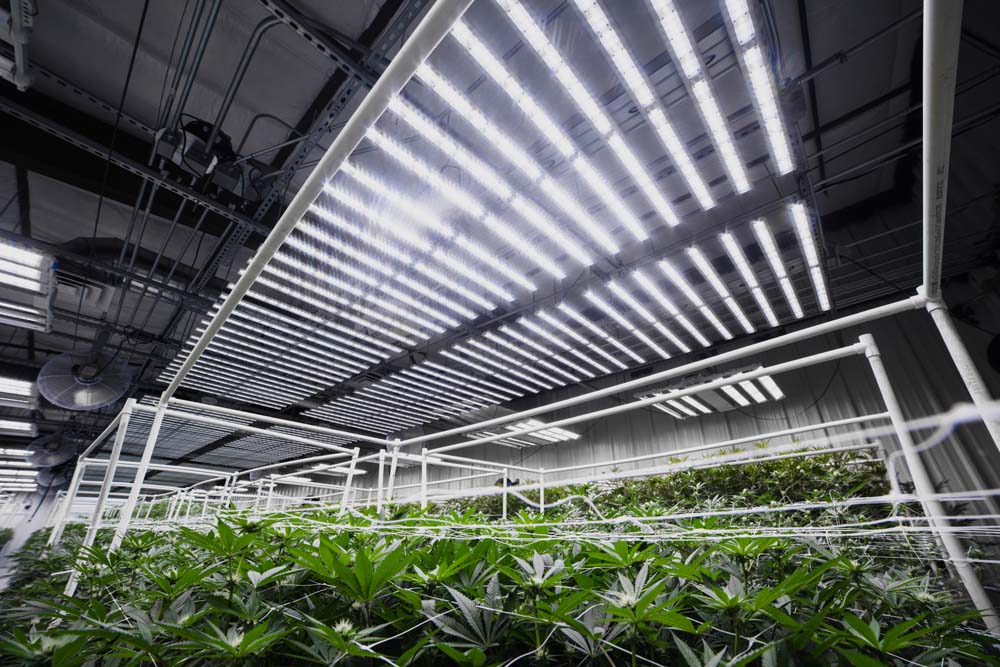
In a sealed room, lighting and climate control are locked in a constant negotiation. Every watt of light energy that isn’t captured by the plant becomes heat, and that heat has to go somewhere, usually through the HVAC system. Excessive run time is often the earliest warning sign of a lighting mismatch, whether that’s fixtures throwing off more infrared than necessary or a layout that creates hot spots the system has to fight.
Track HVAC run time as a percentage of the total light cycle and watch for spikes tied to specific growth stages. A well-matched lighting system, like FOHSE’s HPS-replacement 121 LED fixture, is designed specifically to reduce the infrared load that drives HVAC overwork in retrofit situations.
4. Canopy Penetration
A fixture’s efficacy rating means little if the light never reaches the lower and mid-canopy. Canopy penetration measures how well light intensity holds up as it travels through multiple layers of foliage rather than just landing on the top. Poor penetration forces a grower into a bad trade-off: over-light the top of the canopy and risk bleaching, or accept weaker development everywhere the light can’t reach.
This is why fixture design matters as much as raw output. FOHSE’s A3i, for example, uses swiveling light bars for cross-illumination specifically to push light deeper into dense, high-bay canopies, a direct response to the poor penetration that plagued early-generation LED systems. Measure penetration with a quantum sensor at multiple canopy depths, not just a single reading at the top.
5. DLI Balance
Daily Light Integral (DLI) is the total photon dose a plant receives over 24 hours, and “balance” means that dose staying consistent across the entire canopy footprint, not just strong in the center of the room. A facility can post excellent average DLI numbers while still wasting real energy on edge zones that are over-lit or corners that are under-lit and dragging yield down.
Facilities using greenhouse fixtures like the O6i can request custom PPFD maps based on their specific room dimensions, which is one of the most direct ways to catch DLI imbalance before it costs a harvest rather than after.
6. VPD Stability
Vapor Pressure Deficit (VPD) governs how efficiently a plant transpires, pulls nutrients, and actually uses the light energy it’s being given. When VPD swings, usually driven by lighting heat load fighting against HVAC and dehumidification cycles, plants shift into stress responses that waste the very photons a grower paid to deliver.
Track VPD stability, not just its average. A tight, consistent band is a strong proxy for how well a room’s lighting and climate systems are actually coordinated with each other, rather than working in opposition.
7. Run-to-Run Consistency
A single great harvest doesn’t prove a facility is efficient. Run-to-run consistency tracks variance in yield, kWh/g, and cycle time across multiple grow cycles, and it’s arguably the most business-critical metric on this list, because unpredictability is its own hidden cost, separate from any single cycle’s raw numbers.
High variance almost always points back to environmental or lighting inconsistency that a single-cycle snapshot can’t reveal. It only shows up when cycles are compared side by side over time.
8. Power Density (W/sq ft)
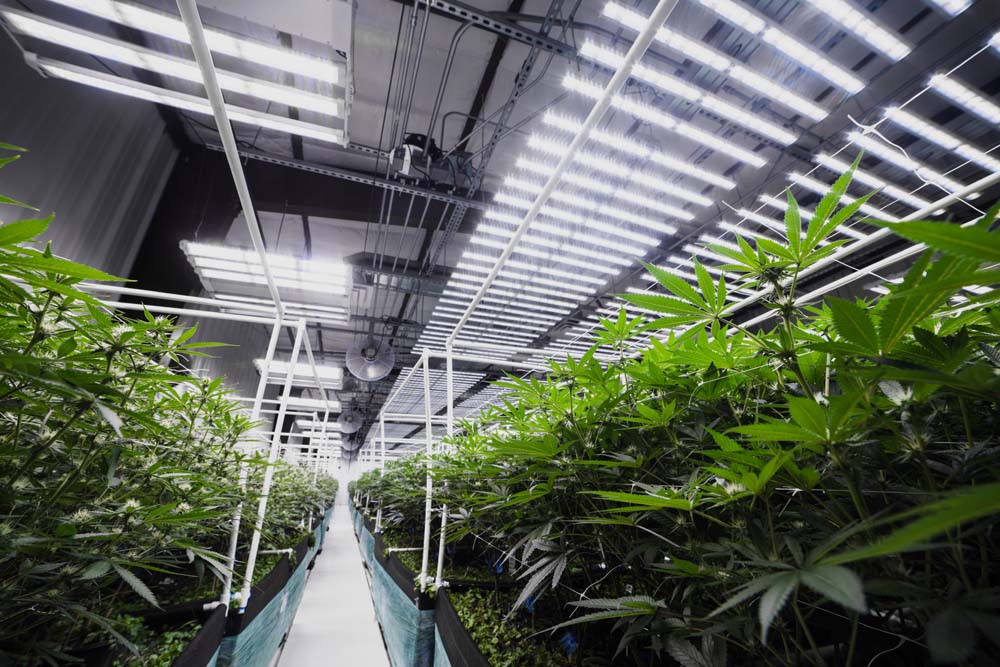
Installed wattage per square foot of canopy is a simple cross-check against every other metric on this list. A room can post strong µmol/J numbers fixture-by-fixture while still being over- or under-lit relative to its actual canopy area, driving unnecessary HVAC load in one case or leaving yield on the table in the other. Comparing power density against the target PPFD for a given crop stage confirms the lighting plan is matched to the room, not just efficient in isolation.
9. Spectral Tuning Ratio
Not every photon is equally useful to a plant at every growth stage. Spectral tuning ratio looks at how well a fixture’s output and its adjustability match what the crop needs during vegetative growth versus flowering. A static, one-spectrum-fits-all light wastes energy producing wavelengths the plant can’t use efficiently at a given point in its lifecycle.
This is part of why propagation-specific fixtures exist at all: FOHSE’s Sirius PRO, for instance, runs three separate spectrum channels so growers can dial in a recipe for early development rather than running a flowering spectrum across an entire cycle.
10. Fixture Uptime and Depreciation
Efficiency is more than performance on day one; it’s about whether that performance holds up over years of operation. Track fixture uptime, failure rates, and light output depreciation (often expressed as L90 or L70 lifespan) to see whether today’s efficacy numbers will still be true in year three. A fixture that degrades quickly quietly erodes every other metric on this list, no matter how good its spec sheet looked at purchase. It’s also, as FOHSE breaks down in 6 Hidden Costs of Inefficient Grow Lighting, one of the easiest costs to miss until it’s already showing up on the books.
The Takeaway
No single metric on this list tells the whole story. A facility chasing an impressive µmol/J number while ignoring HVAC run time or canopy penetration is optimizing one variable at the expense of the system around it. Real energy efficiency comes from treating lighting, climate, and canopy management as one interconnected system, and measuring it that way, cycle after cycle, not just once at commissioning.
Growers who track these ten metrics together, rather than in isolation, are the ones who can defend their energy numbers to an investor, a utility auditor, or their own bottom line. If you’re evaluating where your facility currently stands, FOHSE’s lighting team can model efficiency and ROI projections specific to your room’s layout, crop, and production goals before you change a single fixture.
FAQ
What is a good µmol/J efficacy rating for commercial grow lights?
As of 2026, high-performing commercial LED fixtures typically fall between 2.5 and 3.0 µmol/J. Anything below roughly 2.0 µmol/J is generally considered outdated for new commercial installations. Efficacy should always be checked against independent spec sheets, not marketing claims alone.
What is the difference between µmol/J and kWh/g?
µmol/J measures how efficiently a light fixture converts electricity into usable photons. kWh/g measures how efficiently an entire facility, lighting, HVAC, dehumidification, and all, converts electricity into finished, sellable yield. A fixture can have excellent µmol/J and still contribute to poor facility-wide kWh/g if the rest of the room isn’t tuned to match it.
How does HVAC run time indicate lighting inefficiency?
Excessive HVAC run time often signals that a lighting system is generating more heat than the room needs to remove, usually from excess infrared output or poor fixture placement. Tracking run time alongside lighting schedules helps growers pinpoint whether their HVAC load is being driven by the lights themselves rather than ambient or seasonal conditions.
Why does canopy penetration matter for energy efficiency?
Light that never reaches the lower or mid-canopy is energy spent without a yield return. Poor canopy penetration forces growers to over-light the top of the canopy to compensate, wasting energy and risking light stress, while lower bud sites still underperform. Fixture design, including optics and cross-illumination, directly affects how much of a room’s energy actually reaches usable plant tissue.
What is DLI balance and why does it matter more than average DLI?
DLI balance refers to how evenly Daily Light Integral is distributed across an entire canopy footprint, not just at a single measurement point. A room can show a strong average DLI while still having over-lit and under-lit zones that waste energy and create yield inconsistency. Mapping DLI across the full canopy, such as with a custom PPFD map, reveals imbalances an average figure hides.
How often should growers track these efficiency metrics?
These metrics are most useful when tracked every grow cycle, not just once during equipment installation. Run-to-run consistency in particular can only be evaluated by comparing multiple cycles over time, since a single strong harvest doesn’t confirm that a facility’s energy use is actually optimized.
Can switching from HPS to LED improve all of these metrics at once?
Not automatically. LED retrofits typically improve µmol/J and reduce HVAC load compared to HPS, but gains in canopy penetration, DLI balance, and kWh/g depend on fixture selection, placement, and spectrum, not the light source technology alone. A facility should model expected changes across all ten metrics before a retrofit, not just efficacy.


