


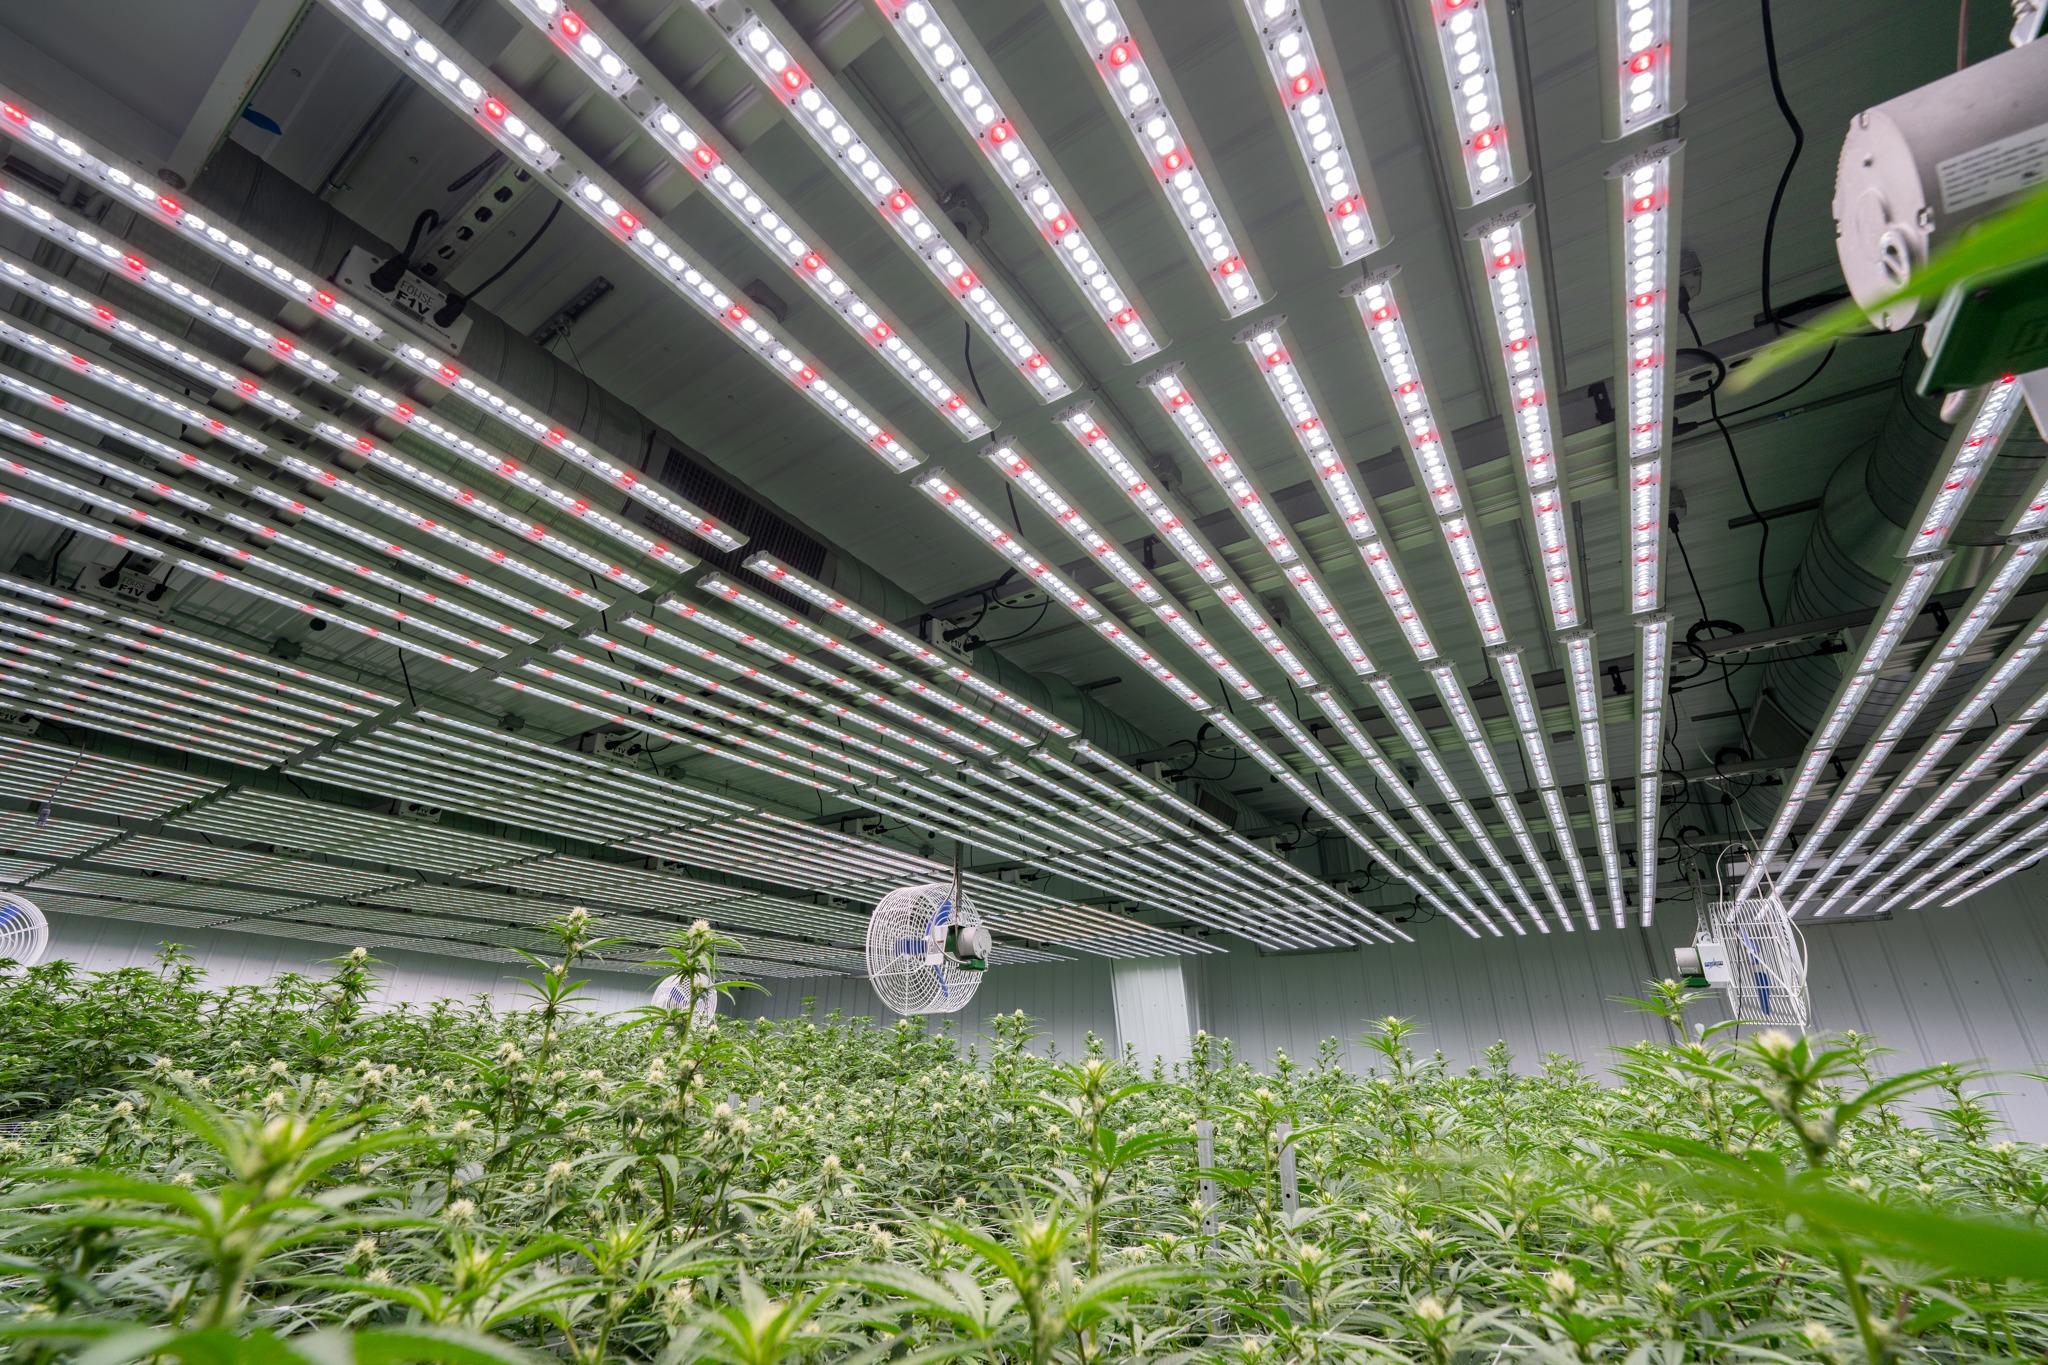
Increasing crop yield with lighting sounds simple: give plants more light, get more growth. At a commercial scale, it’s more complicated.
Adding fixtures or increasing intensity can raise photosynthetic photon flux density (PPFD), but it can also expose weaknesses elsewhere. Uneven distribution creates inconsistent growth. Excess intensity increases cooling and irrigation demand. Inefficient fixtures turn electricity into unnecessary operating cost. And once a crop has enough light, additional photons may deliver diminishing returns. The better question is: How much usable light is reaching the crop, how evenly is it being delivered, and how much saleable yield are you producing from that input?
Here’s how to find out.
1. Stop Managing Lighting by Wattage Alone
Watts tell you how much power a fixture consumes. They don’t tell you how much photosynthetically active radiation reaches the crop. PPFD, measured in µmol·m⁻²·s⁻¹, measures the photon flux reaching the canopy. But even PPFD needs context. A reading of 700 µmol·m⁻²·s⁻¹ might be appropriate for one crop and excessive or insufficient for another. Greenhouses also receive sunlight, which changes with season, weather, glazing, and shading. Michigan State University notes that greenhouse structures and glazing can reduce incoming light by roughly 35–50%.
What to do
Measure PPFD at actual canopy height using a grid across the production area. Record the minimum, maximum, and average. If the center measures 700 µmol·m⁻²·s⁻¹ while the perimeter receives 450, you don’t really have a “700 PPFD” lighting strategy. You have crops growing under substantially different conditions.
Ask your team: Do we know what the weakest areas of the canopy are actually receiving?
2. Measure DLI, Not Just PPFD
PPFD is a snapshot. Daily Light Integral (DLI) measures the total photosynthetically active light the crop receives over a full day. For constant light:
DLI = PPFD × photoperiod in seconds ÷ 1,000,000
For example, 300 µmol·m⁻²·s⁻¹ for 16 hours delivers approximately 17.3 mol·m⁻²·d⁻¹. At 500 µmol·m⁻²·s⁻¹, that increases to 28.8 mol·m⁻²·d⁻¹. There is no universal “best DLI.” The correct target depends on crop, cultivar, growth stage, environment, and production goal.
What to do
Establish a target DLI for each major crop and growth stage, then measure what plants actually receive. For greenhouse operations, account for sunlight first. If your crop needs 18 mol·m⁻²·d⁻¹ and sunlight supplies 13, supplemental lighting only needs to close the 5-mol gap. Track target DLI, actual DLI, lighting runtime, and harvested yield together.
3. Fix Uniformity Before Increasing Intensity
One of the easiest ways to waste lighting capacity is to increase output because the darkest part of the canopy is below target. Consider a production zone with:
- Average PPFD: 600 µmol·m⁻²·s⁻¹
- High point: 750 µmol·m⁻²·s⁻¹
- Low point: 420 µmol·m⁻²·s⁻¹
Increasing every fixture by 15% helps the low zone, but it also pushes the high zone above 860 µmol·m⁻²·s⁻¹. You’ve increased electricity consumption without fixing the distribution problem.
What to do
Map canopy-level PPFD and calculate:
Uniformity = minimum PPFD ÷ average PPFD
A room averaging 600 µmol·m⁻²·s⁻¹ with a minimum of 480 has 80% min-to-average uniformity. Before adding power, inspect fixture spacing, mounting height, beam distribution, structural shadows, obstructions, and canopy height. Then overlay your light map with production data.
Ask: Are our low-yield areas also our low-light areas?
4. Calculate How Efficiently Electricity Becomes Light
Two fixtures drawing the same wattage can produce very different amounts of plant-usable light. Photosynthetic photon efficacy (PPE), expressed in µmol/J, measures how efficiently a fixture converts electrical energy into PAR photons. At scale, small differences matter. A 1,000-watt fixture operating 16 hours per day consumes 16 kWh. Across 500 fixtures, that’s 8,000 kWh per day. At $0.10/kWh, lighting electricity alone costs roughly $800 per day before HVAC, pumps, dehumidification, or other equipment.
What to do
Don’t compare lighting systems on wattage or purchase price alone. Evaluate fixture efficacy, delivered PPFD, coverage area, operating hours, and electricity cost against production. A useful facility KPI is:
kg of saleable crop ÷ lighting kWh
That tells management much more about lighting performance than wattage alone.
5. Treat Lighting and HVAC as One System
Every lighting change affects the environment around the crop. Higher light levels can increase photosynthesis when the rest of the environment supports it. But they can also change crop water demand, leaf temperature, transpiration, cooling requirements, and humidity management. That means “increase the lights by 20%” should never be an isolated cultivation decision.
What to do
When changing intensity or photoperiod, trend lighting alongside:
- Air and leaf temperature
- Relative humidity and VPD
- Irrigation volume and frequency
- HVAC and dehumidification runtime
- Crop growth and final yield
If DLI increases 10%, can irrigation, HVAC, CO₂ management where used, and humidity control maintain the target environment? If not, additional photons may not translate proportionally into additional saleable crop.
6. Use Dimming as a Production Tool
Commercial lighting doesn’t necessarily need to operate at 100% whenever fixtures are on. Greenhouses are the obvious example. On bright days, sunlight may provide much of the crop’s required DLI. On darker days, supplemental lighting can fill the gap. Indoor operations can apply the same principle across growth stages. Young plants may not require the same intensity as a mature canopy.
What to do
Build lighting recipes around crop stage and target DLI, not simply “lights on” and “lights off.”
Track:
Crop stage → PPFD → photoperiod → DLI → energy use → harvest result
Over multiple cycles, those records become a facility-specific lighting model instead of a generic recommendation.
7. Measure Yield per Photon
Yield per square foot tells you how productive a facility is. It doesn’t tell you how efficiently lighting helped produce that yield. Add metrics such as:
Saleable yield per lighting kWh
and, where your data allows:
Saleable yield per mole of light delivered
If lighting energy increases 20% while saleable yield increases only 5%, the economics deserve scrutiny. If energy rises 8% while yield increases 15%, that tells a very different story.
What to do
Run controlled comparisons whenever possible. Change one major lighting variable at a time and record PPFD, DLI, energy use, environmental conditions, cycle length, quality, waste, and saleable yield. Now cultivation, engineering, operations, and finance are looking at the same performance data.
Better Lighting Means Getting More From Every Photon
Increasing crop yield doesn’t start with adding more wattage. It starts with understanding where the photons you already pay for are going.
Measure PPFD across the canopy. Calculate DLI. Identify under-lit and over-lit zones. Evaluate fixture efficacy. Connect lighting changes to HVAC and irrigation demand. Then measure the result in a saleable crop per unit of energy.
When those numbers are visible, lighting stops being an overhead expense and becomes a production system you can optimize.
See What Your Current Lighting System Is Leaving on the Table
FOHSE can evaluate your existing lighting layout, target PPFD and DLI, fixture performance, coverage, and production goals to identify where distribution or system efficiency may be limiting your operation. Request a lighting assessment to identify opportunities to improve canopy coverage, photon delivery, and lighting efficiency before adding more electrical load.
Frequently Asked Questions About Crop Yield and Lighting
How can better lighting increase crop yield?
Better lighting can increase crop yield by delivering the right amount of photosynthetically active radiation across the entire canopy. The goal isn’t simply more light—it’s the right PPFD and DLI for the crop, delivered uniformly while maintaining appropriate temperature, humidity, irrigation, and other environmental conditions.
What is the best light intensity for crop growth?
There is no single ideal light intensity for every crop. Target PPFD depends on the crop, cultivar, growth stage, photoperiod, environment, and production goals. Measure PPFD at canopy level and use it with DLI to determine whether plants are receiving the appropriate amount of light each day.
What is DLI and why does it matter for crop yield?
Daily Light Integral (DLI) measures the total amount of photosynthetically active light a crop receives during a 24-hour period, expressed in mol·m⁻²·d⁻¹. Tracking DLI helps growers manage total daily light rather than relying on a single PPFD measurement.
Does increasing PPFD always increase yield?
No. Increasing PPFD does not automatically produce a proportional increase in yield. Crop response depends on factors including species, growth stage, DLI, temperature, CO₂ availability, irrigation, nutrition, and humidity. Once another factor becomes limiting, additional light may provide diminishing production returns.
Why is light uniformity important for crop production?
Light uniformity helps ensure plants across the production area receive similar amounts of usable light. Poor uniformity can create under-lit and over-lit zones, contributing to inconsistent growth, maturity, quality, and yield. Mapping PPFD across the canopy can identify these variations before simply increasing fixture output.
How do you measure light efficiency?
Fixture efficiency is commonly measured using photosynthetic photon efficacy (PPE), expressed in µmol/J. At the facility level, growers can go further by tracking metrics such as saleable crop per lighting kWh. This connects lighting energy consumption directly to production performance.


